A
No Action Required
Minimal surface distress. Routine monitoring and normal maintenance are recommended.
Dronnix combines high-resolution drone mapping and AI-powered analysis to assess road condition across corridors, municipal streets, and private access roads in one repeatable workflow.
Cracks, edge breakup, rutting, and potholes often start as localized surface defects. When they are missed, moisture enters the pavement structure and small repairs become reconstruction work.
Manual road surveys are slow, inconsistent, and difficult to repeat across a full municipal network. Aerial mapping creates a visual record that can be measured, compared, and revisited.
Maintenance plans are stronger when every defect is mapped, measured, and prioritized.
Step 1 - Drone mapping. The drone captures systematic, overlap-optimized RGB imagery across the road corridor to create a complete photographic record.
Step 2 - AI defect detection. Computer vision models identify cracks, potholes, surface breakup, rutting, and edge damage with consistent detection thresholds.
Step 3 - Classification and report. Each segment receives a condition class based on defect density and severity, delivered with maps, inventories, and planning summaries.
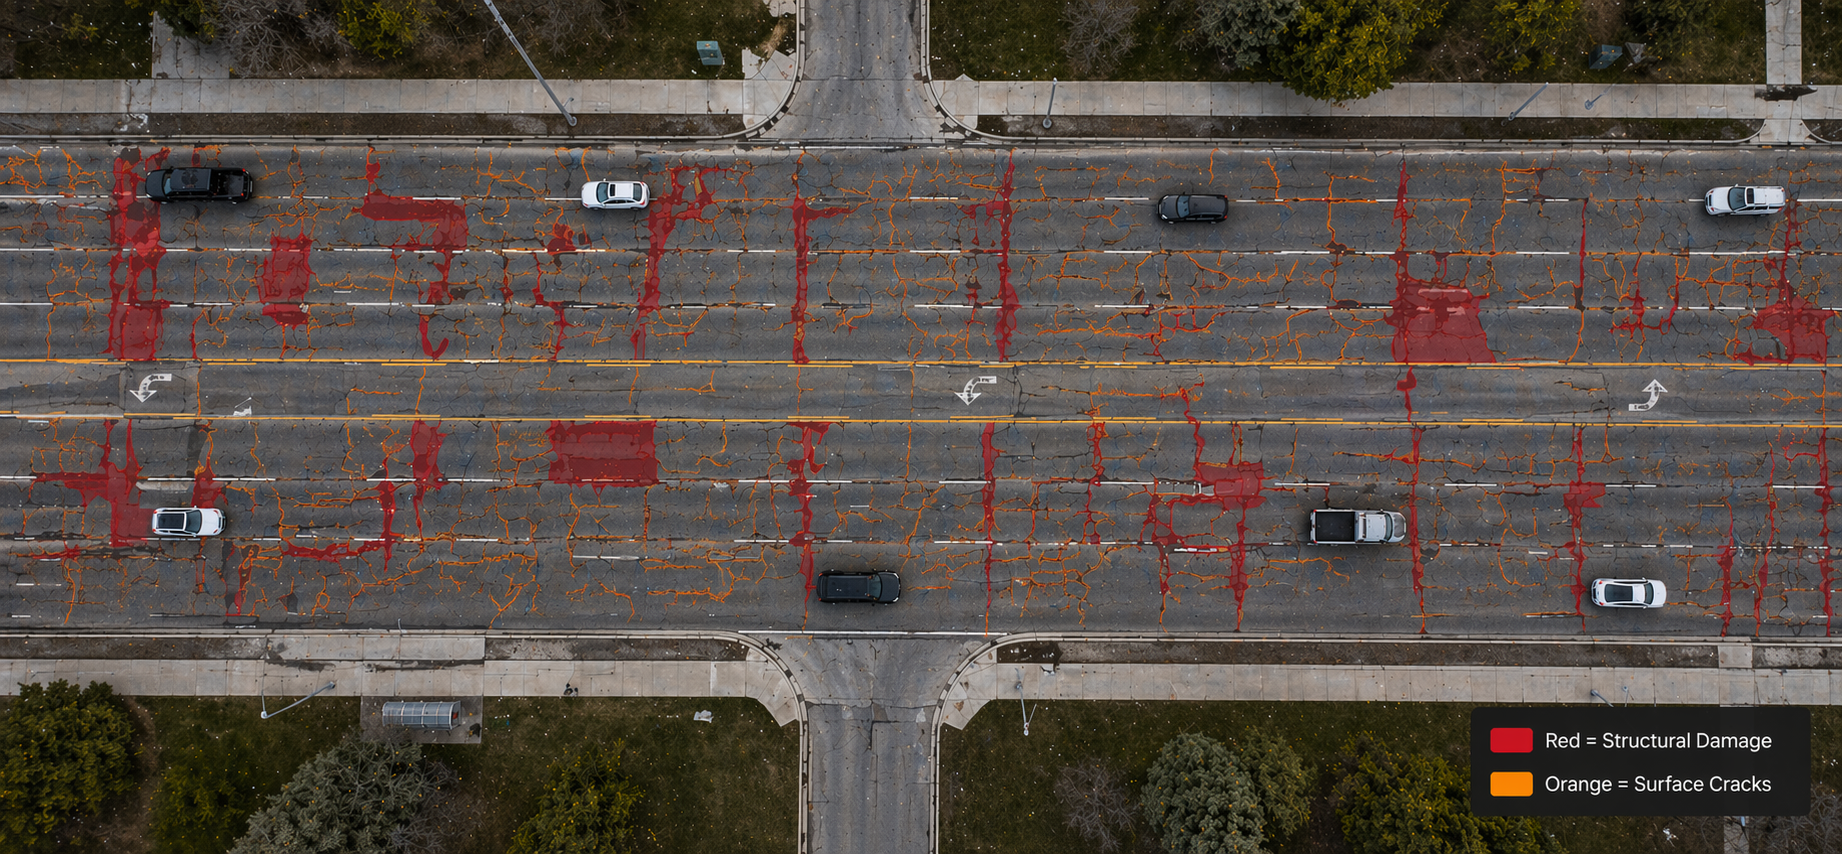
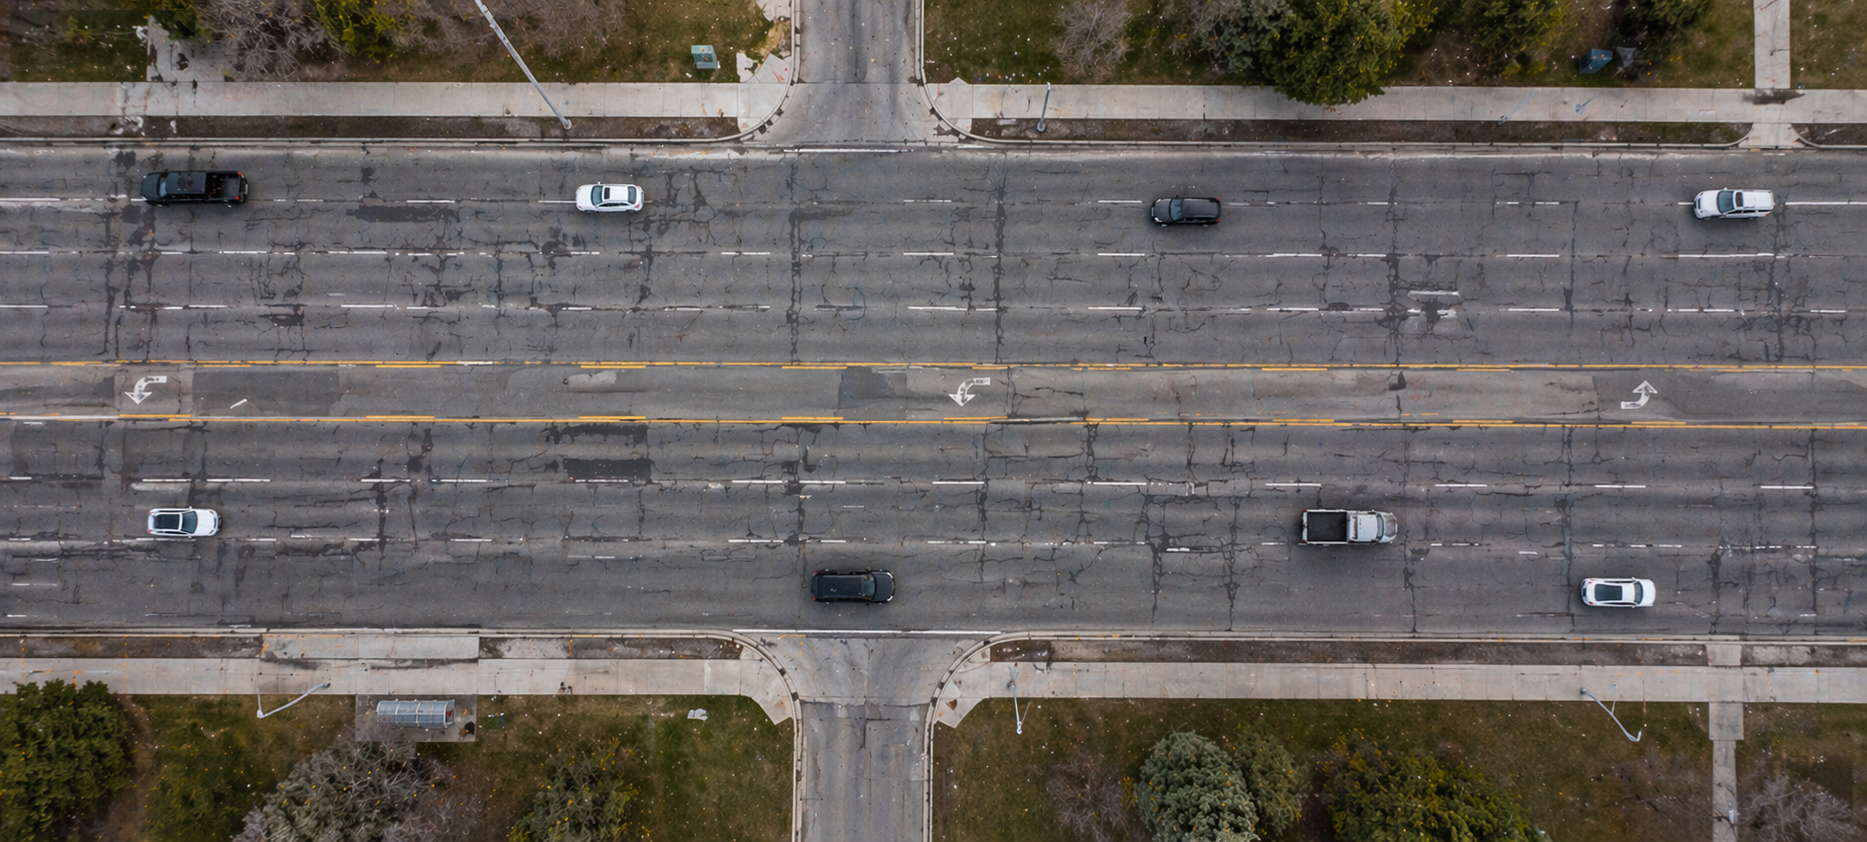
Drag to compare raw imagery and AI output
Defect type, density, and severity are converted into clear classes so maintenance teams can compare segments and plan work by priority.
Minimal surface distress. Routine monitoring and normal maintenance are recommended.
Minor cracking or early wear. Seal coating or localized treatment can extend service life.
Moderate defects. Patching, resurfacing, or targeted repair should be planned.
Severe damage. Urgent repair, reconstruction, or safety review is required.
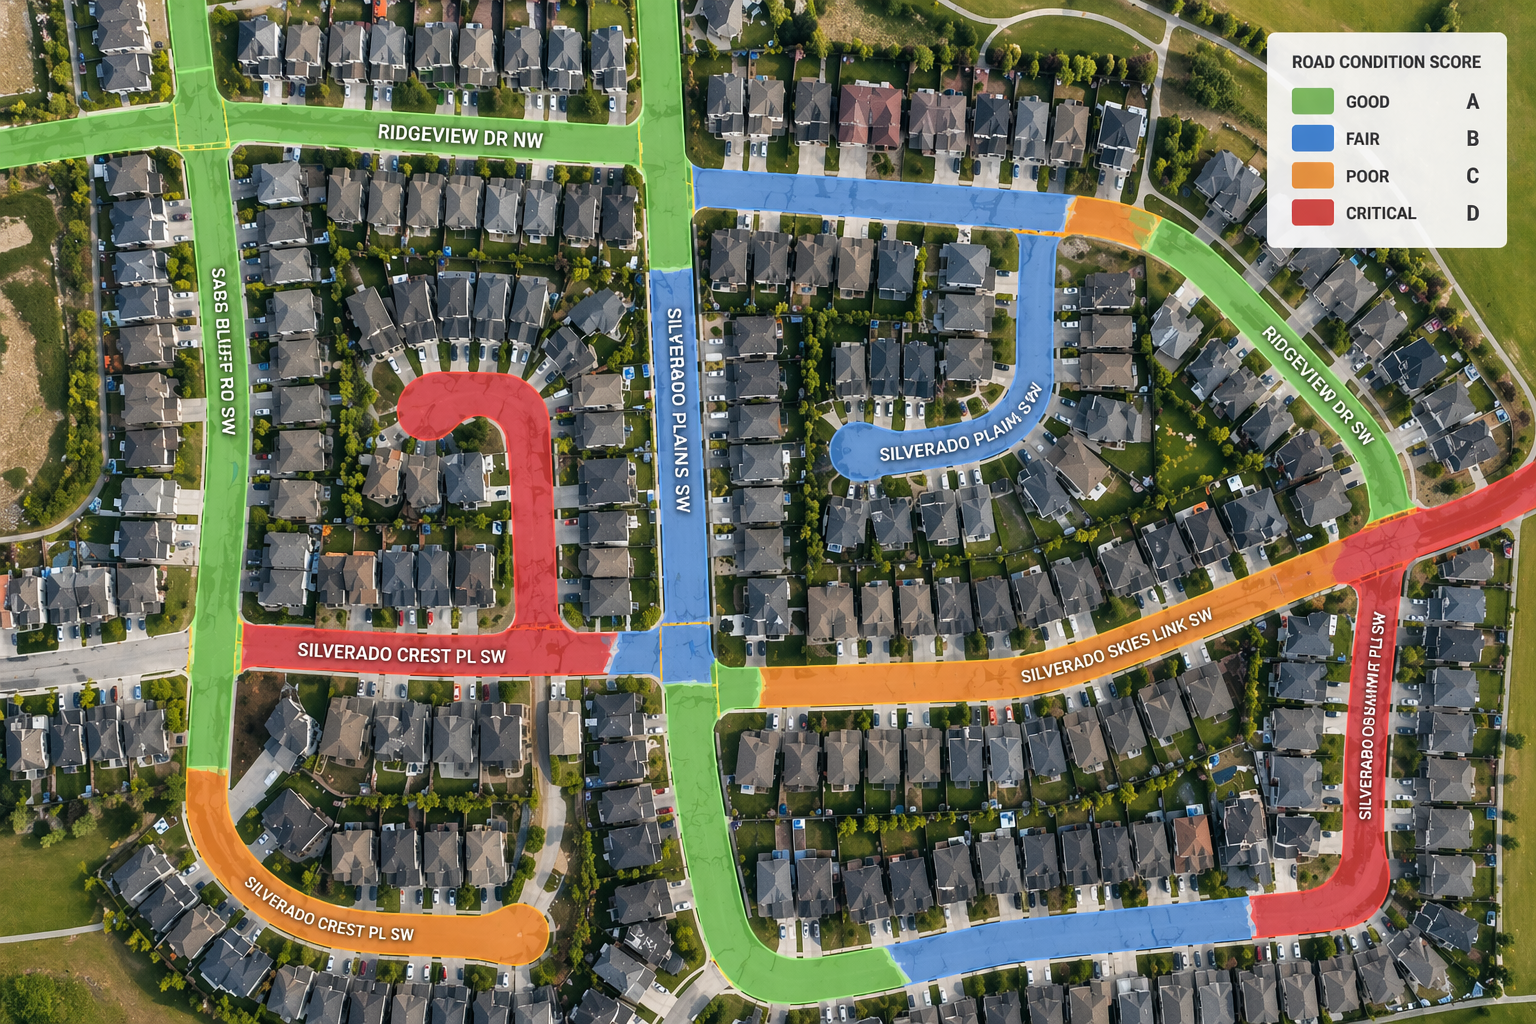
Geo-referenced orthomosaic with color-coded segment scores and visible defect context.
GIS-ready defect records with type, severity, GPS location, and measured area or length.
Segment ranking and recommended repair priority for municipal planning and budgeting.
Marked-up image evidence that helps crews verify field conditions before dispatch.
One flight creates a consistent record across the whole route, with less disruption and cleaner data for long-term asset management.
| Capability | Dronnix Road Analysis | Manual Road Survey |
|---|---|---|
| Surface coverage | Full corridor | Visual sample or driven notes |
| Lane closure required | No routine closure | Often required for close inspection |
| Defect location | GPS-tagged records | Manual references |
| Repeatability | Consistent detection workflow | Varies by crew and conditions |
| Planning output | GIS-ready dataset | Report notes and photos |
| Before/after tracking | Comparable imagery over time | Harder to normalize |
Send us the route, area, or municipal network you want assessed. We will scope the flight plan and quote the deliverables your team needs.