Hotspots
Cells generating heat instead of electricity, caused by defective cells, short circuits, or mismatch effects.
Dronnix combines thermal and RGB drone capture to map utility-scale and commercial solar assets fast. We identify hotspots, classify visible issues, and deliver GPS-tagged findings your operations team can move on immediately.
 AI-Assisted Review
A commercial rooftop installation with undetected faults does not fail visibly; it quietly underperforms. Individual panels can degrade, short-circuit, or overheat for months without triggering any system-level alarm.
Traditional ground inspection has real limits at scale. On a large site, a full manual survey can take days, and still only cover a fraction of panels to contain costs.
By the time a problem is visible, the energy loss has already occurred.
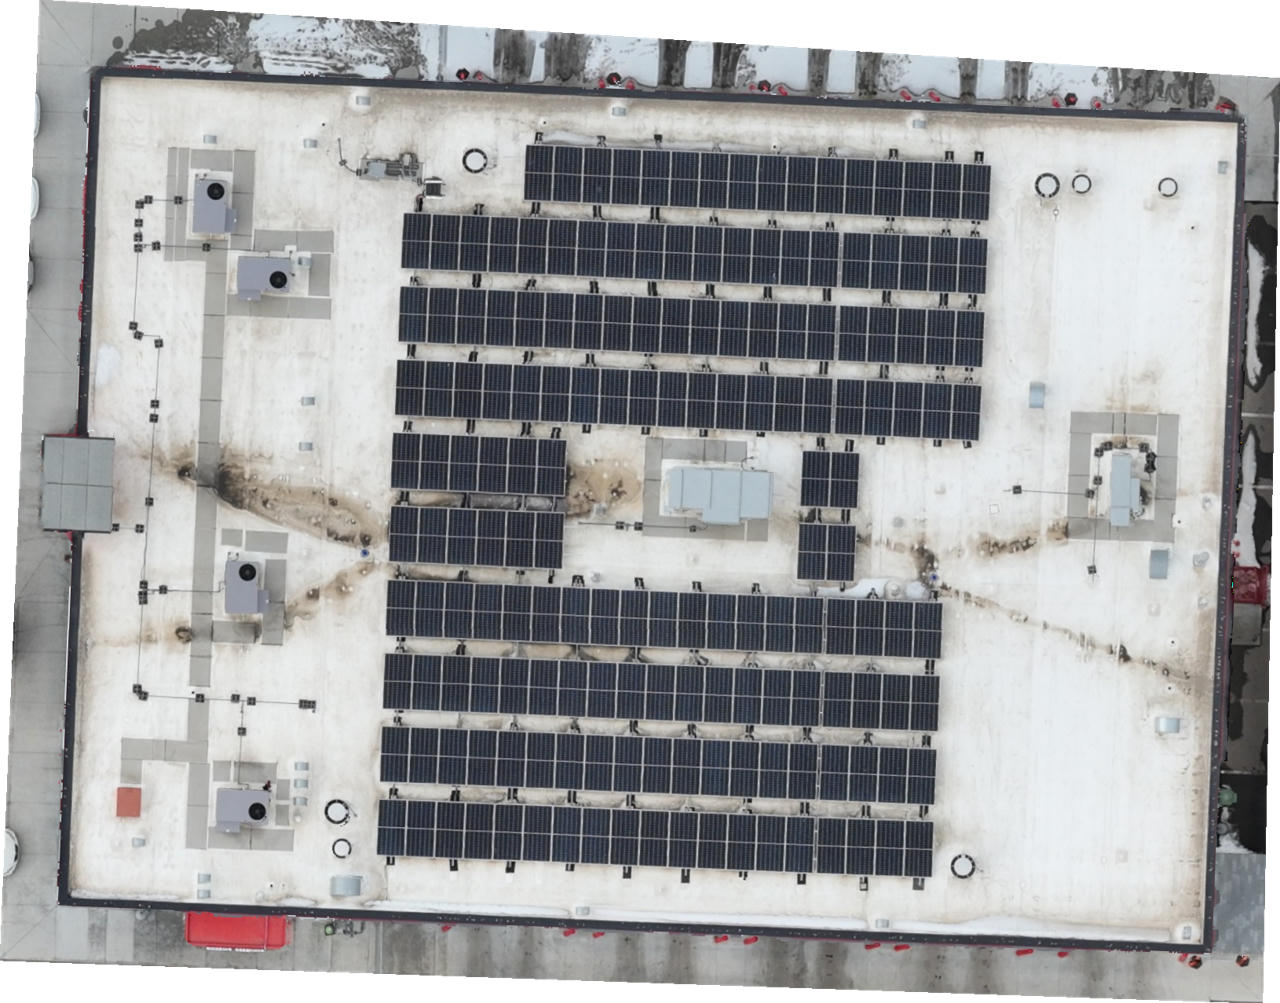
Step 1 — RGB capture. High-resolution visible imagery documents physical panel condition: cracks, soiling, shading, and mounting damage across the full rooftop.
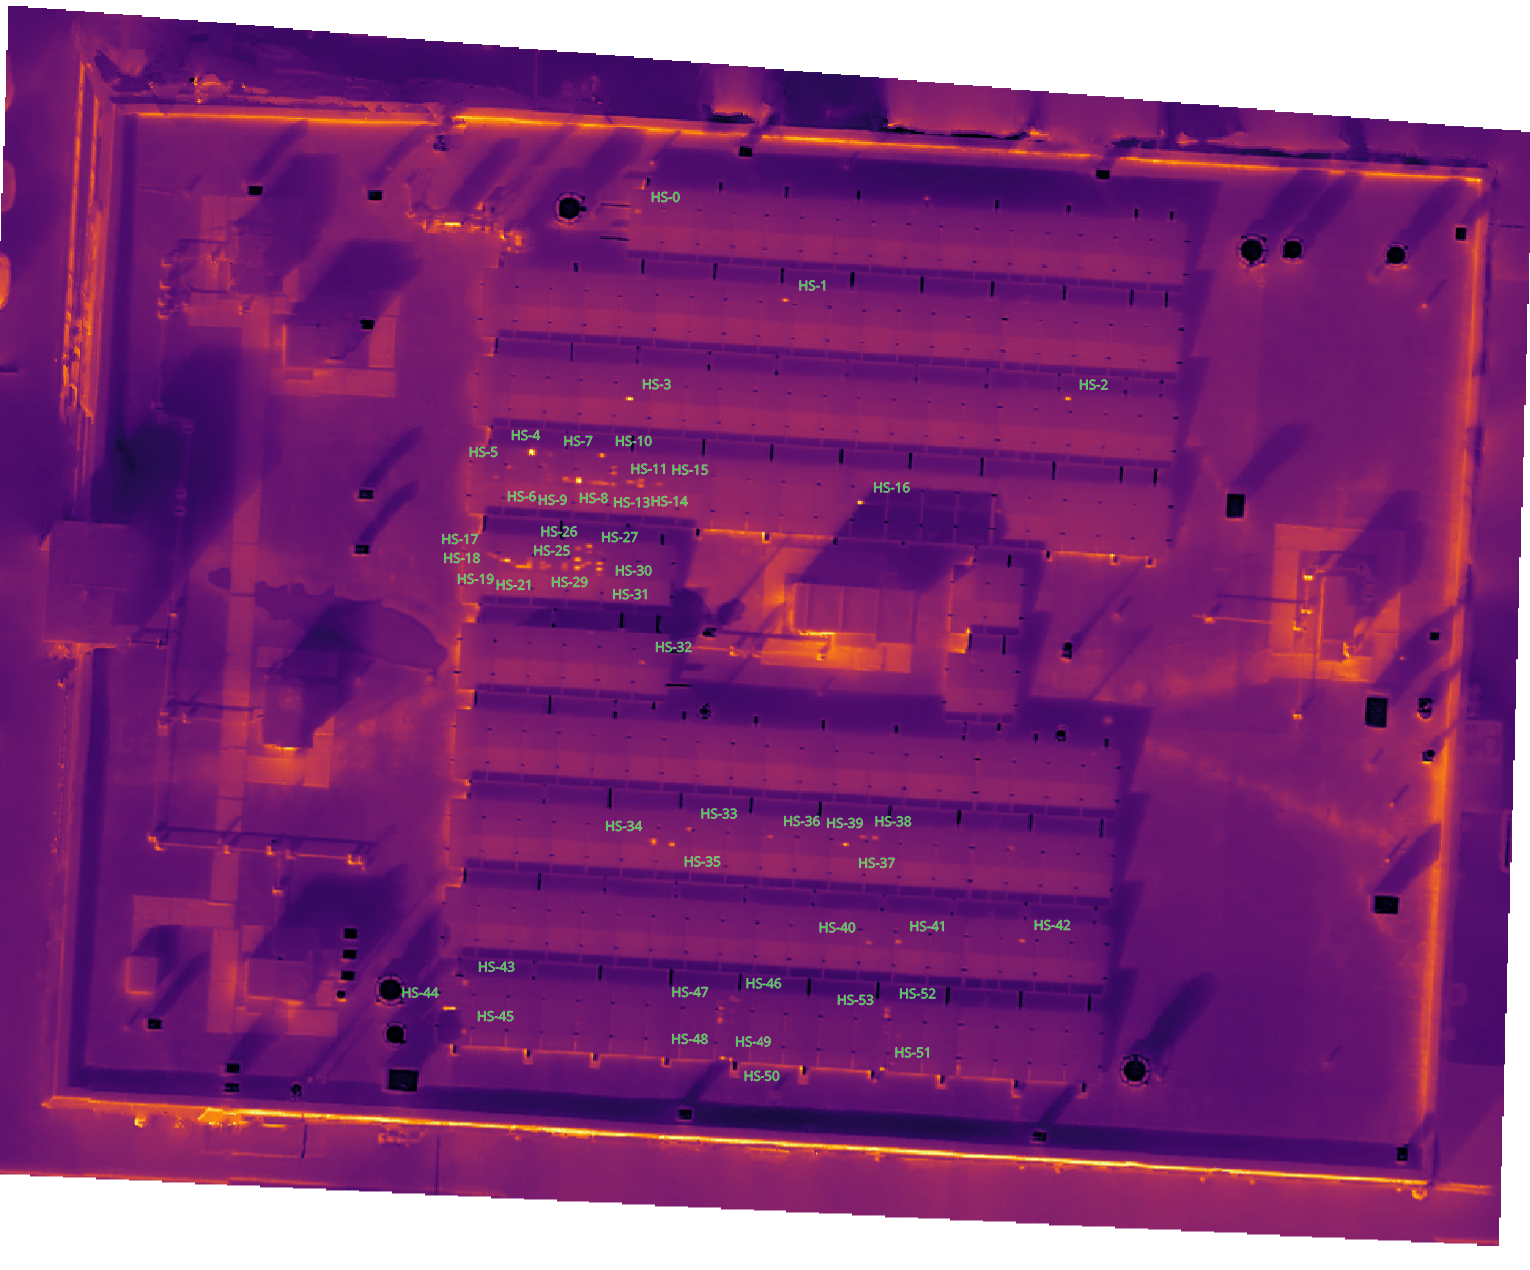
Step 2 — Thermal imaging. The infrared sensor reads every panel's surface temperature. Faults generate hotspots invisible to the naked eye but unmistakable in thermal data.
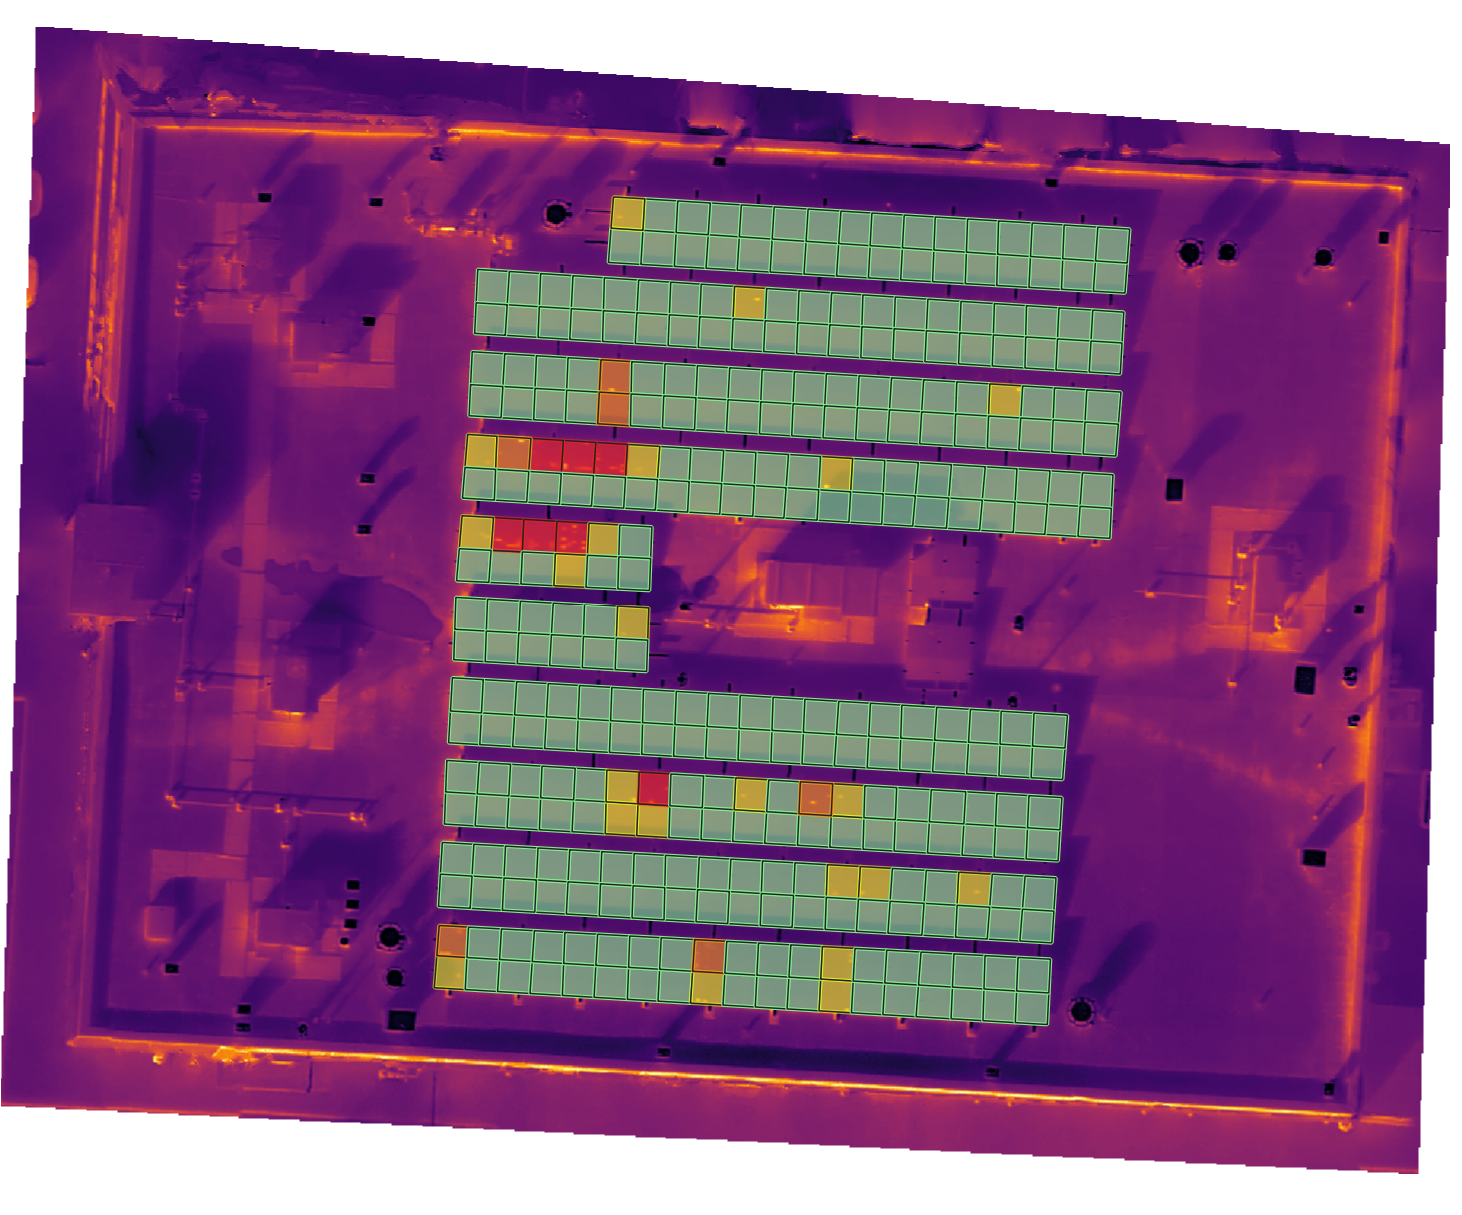
Step 3 — AI hotspot and panel detection. A detection model automatically locates every thermal anomaly and segments individual panel boundaries across the full orthomosaic, no manual marking required.
Step 4 — AI classification. Each detected panel is assigned a fault severity class: Healthy, Moderate, High Fault, or Critical. Every result is GPS-tagged and ready for maintenance dispatch.
Drag to compare sensors
The rooftop looks normal in visible light. Move your cursor anywhere over it; the drone flies to that position and its thermal sensor reveals the hidden layer beneath.
Move your cursor over the rooftop to reveal thermal data
After capture, our AI pipeline runs without manual input. It detects every thermal anomaly, segments individual panel boundaries across the full orthomosaic, and classifies each panel by fault severity before the crew is back on the ground.
Cells generating heat instead of electricity, caused by defective cells, short circuits, or mismatch effects.
Entire strings offline due to connection faults, combiner box failures, or open circuit conditions.
Localized overheating of a defined sub-section of a panel, identifiable by characteristic thermal patterns.
Dirt, dust, or vegetation reducing output across specific rows or sections of the array.
Cracks, delamination, and surface defects documented with high-resolution RGB for warranty and insurance records.
Potential Induced Degradation: systematic losses detectable through thermal pattern analysis across affected modules.
A full geo-referenced thermal map with all anomalies marked by location and severity.
High-resolution visual map for physical defect documentation and site layout reference.
Every fault with GPS coordinates, fault classification, temperature delta, and severity ranking.
Matching thermal and RGB images for each flagged panel so your team knows what to look for.
Severity-ranked overview of findings, total fault count by type, and recommended priorities.
One flight. Every panel. Site stays online. Results in hours instead of days.
| Capability | Dronnix Drone Inspection | Manual Ground Inspection |
|---|---|---|
| Full-site turnaround | Same day | 2–5 days |
| Panel coverage | 100% of site | 10–25% sample |
| Site shutdown required | ✓ No shutdown needed | ✗ Section shutdowns |
| GPS-tagged fault locations | ✓ Every fault | ✗ Manual notes only |
| Consistent detection threshold | ✓ Uniform across site | ✗ Declines with fatigue |
| Thermal + RGB orthomosaic | ✓ Delivered | ✗ Not available |
| Pattern-level fault detection | ✓ AI-assisted | ✗ Panel-level only |
Send us the site details and we'll put together a flight plan and quote. Inspections available across Alberta, with broader coverage on request.